
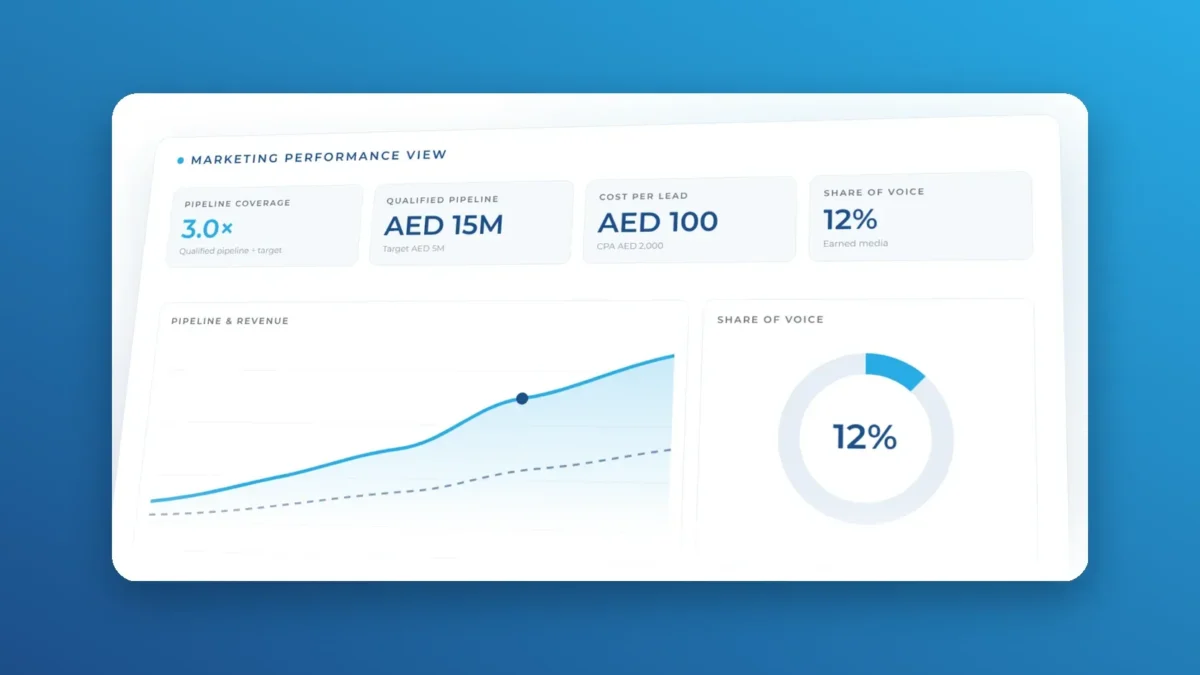
A practical executive guide to the marketing performance metrics that measure impact, from activity to revenue.
By Soula Baroudi, Partner Marketing at Synergi
Marketing measurement must connect activity to business growth
Marketing has never produced more data. Every platform offers dashboards filled with impressions, clicks, followers, views and engagement. Yet many CEOs still ask a reasonable question: is our marketing department actually performing?
The answer cannot be found in one metric, and certainly not in follower count alone. A high-performing marketing function must create demand, strengthen the brand, support the sales pipeline and contribute to sustainable, profitable growth.
This is particularly important in B2B organizations, where buying decisions involve several stakeholders and may take months. A prospect may see a thought-leadership post, attend a webinar, read a case study, receive an email and speak to a sales representative before signing a contract. Judging marketing by the final click misses most of the journey.
The practical solution is a balanced scorecard that connects marketing activity to commercial outcomes. The following seven groups of marketing performance metrics give leadership a more complete and credible view of how marketing is really performing.
Executive matrix of marketing performance metrics
Use this matrix to agree which marketing performance metrics each leadership review covers, where the data comes from and how often it is checked.
| Measurement area | What it reveals | Primary data source | Review cycle |
|---|---|---|---|
| Revenue and pipeline | Commercial contribution | CRM and finance | Monthly and quarterly |
| ROAS, CPL and CPA | Paid efficiency and acquisition cost | Ad platforms and CRM | Weekly and monthly |
| CAC and LTV | Sustainability of growth | Finance, CRM and Sales | Monthly and quarterly |
| CRM conversion and velocity | Lead quality and sales progression | CRM | Weekly and monthly |
| SOV, SOS and market share | Competitive visibility and demand | Media, search and market data | Quarterly |
| Social and brand demand | Audience relevance and intent | Social analytics and GA4 | Monthly |
| Marketing investment ratio | Adequacy and productivity of investment | Finance and marketing | Quarterly and annual |
01. Marketing contribution to revenue and pipeline
The most important question is not how many leads marketing generated, but how much commercially relevant demand it created. Companies using a CRM should distinguish between marketing-sourced activity, in which marketing generated the opportunity, and marketing-influenced activity, in which marketing supported an opportunity created elsewhere.
| Metric | Calculation method |
|---|---|
| Marketing-sourced pipeline | Total value of qualified open opportunities originally generated by marketing |
| Marketing-sourced revenue % | Revenue from customers originally generated by marketing ÷ total revenue × 100 |
| Marketing-influenced revenue % | Revenue from closed deals with at least one qualifying marketing touchpoint ÷ total revenue × 100 |
| Pipeline coverage | Value of qualified open pipeline ÷ revenue target for the same period |
| Revenue per campaign | Revenue attributed to the campaign ÷ number of campaigns or campaign investment |
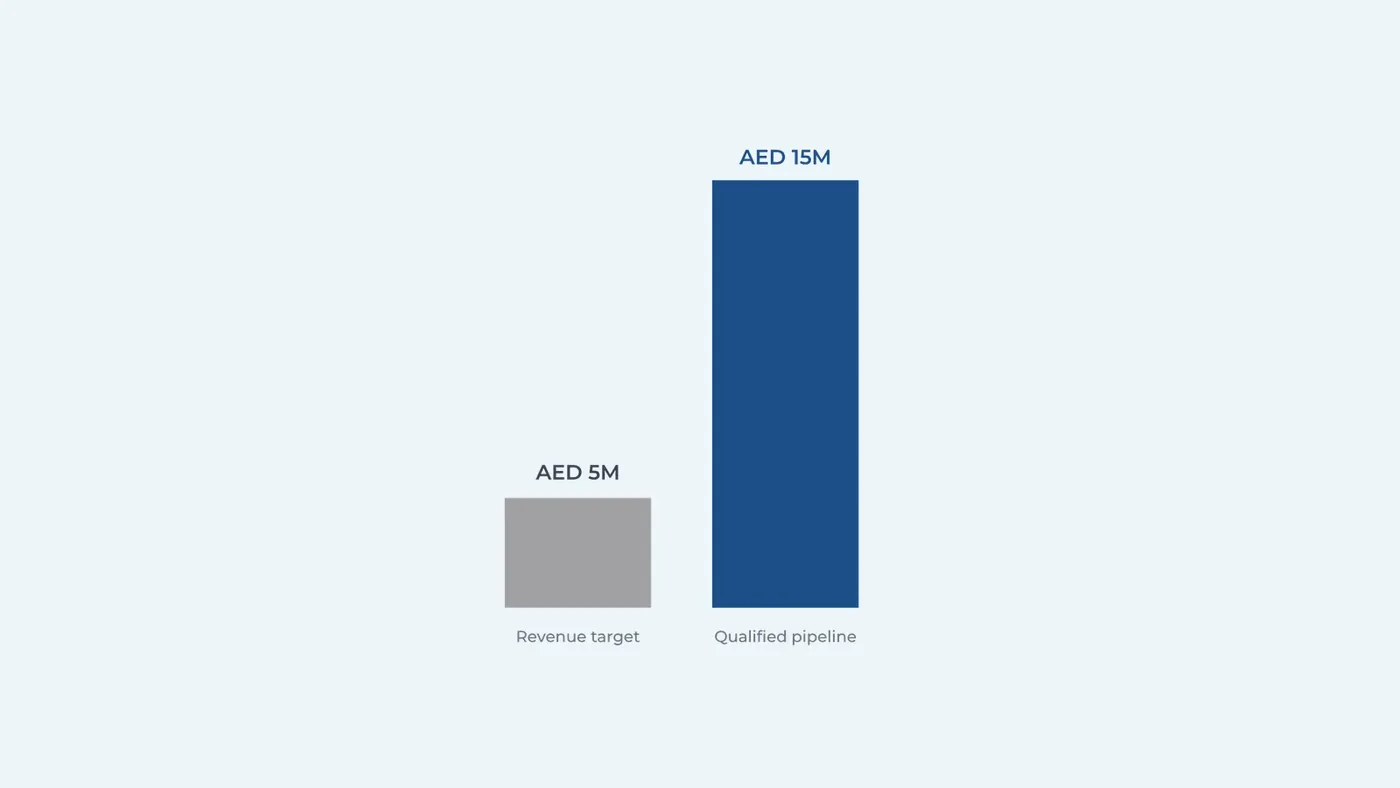
3× pipeline coverage If the revenue target is AED 5 million and the qualified pipeline is AED 15 million, pipeline coverage is 3×.
Attribution rules must be agreed in advance. The company should define what counts as a qualified marketing touchpoint and apply that definition consistently in the CRM.
02. Return on ad spend and marketing ROI
ROAS compares advertising revenue with media spend. It is useful for comparing paid campaigns, audiences and creative executions. However, it does not include salaries, agency fees, technology, production, events or other marketing costs. Leadership should therefore review it alongside total marketing ROI.
| Metric | Calculation method |
|---|---|
| Return on ad spend (ROAS) | Revenue attributed to advertising ÷ advertising spend |
| Marketing ROI | (Incremental gross profit attributable to marketing − total marketing cost) ÷ total marketing cost × 100 |
Key insight. Using gross profit rather than revenue provides a more realistic commercial view, especially when products or services have different margins.
Cost per lead and cost per acquisition
CPL and CPA answer different questions. CPL measures how efficiently marketing generates enquiries, while CPA shows the cost of converting those enquiries into customers.
AED 20,000 Campaign cost
200 Leads generated
AED 100 Cost per lead
10 Customers acquired
AED 2,000 Cost per acquisition

Example. If a campaign costs AED 20,000 and generates 200 leads, CPL is AED 100. If 10 of those leads become customers, CPA is AED 2,000. The lowest CPL is not automatically the best result. A channel may generate many inexpensive leads that never progress, while another produces fewer but higher-value opportunities.
| Metric | Calculation method |
|---|---|
| Cost per lead (CPL) | Total campaign or marketing spend ÷ number of leads generated |
| Cost per acquisition (CPA) | Total campaign or marketing spend ÷ number of customers acquired |
| Cost per qualified lead (CPQL) | Total campaign spend ÷ number of leads meeting the agreed qualification criteria |
03. Customer acquisition cost and lifetime value
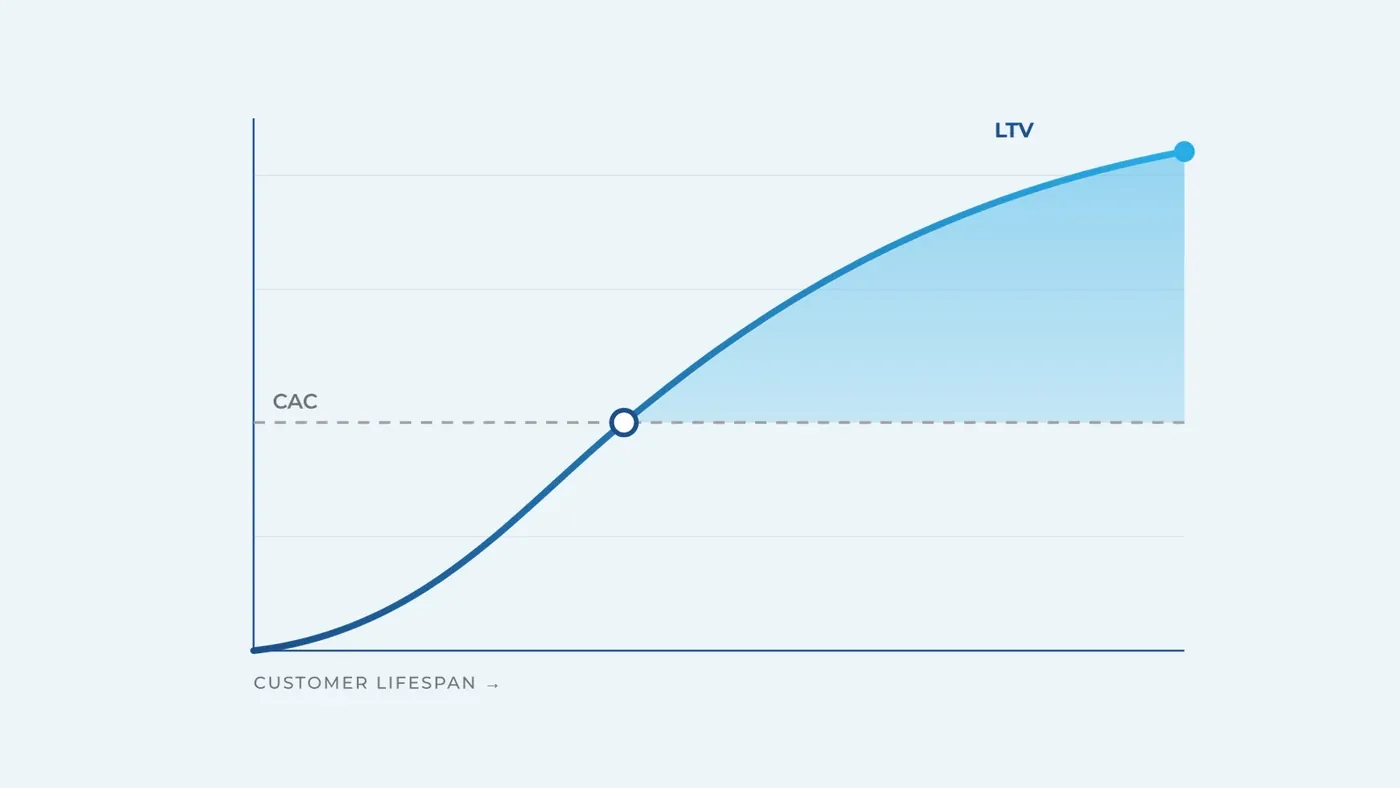
CAC shows how much the company spends across Marketing and Sales to acquire a new customer. It becomes more useful when compared with customer lifetime value. A low-cost lead is not valuable if that customer purchases once, requires heavy servicing or leaves quickly.
| Metric | Calculation method |
|---|---|
| Customer acquisition cost (CAC) | Total Sales and Marketing acquisition cost ÷ new customers acquired |
| Customer lifetime value (LTV) | Average purchase value × purchase frequency per year × customer lifespan in years × gross margin % |
| LTV to CAC ratio | Customer lifetime value ÷ customer acquisition cost |
These marketing performance metrics should be monitored by customer segment, product, geography and acquisition channel, not only as company-wide averages. This helps leadership see where growth is both scalable and profitable.
04. CRM funnel conversion and pipeline velocity
A CRM should be more than a contact database. It should show where demand is progressing, slowing down or being lost. The same conversion formula can be applied at every stage of the customer journey.
| Metric | Calculation method |
|---|---|
| Stage conversion rate | Number progressing to the next stage ÷ number entering the current stage × 100 |
| Visitor to lead rate | New leads ÷ unique website visitors × 100 |
| MQL to SQL rate | Sales qualified leads ÷ marketing qualified leads × 100 |
| Opportunity win rate | Closed-won opportunities ÷ total closed opportunities × 100 |
| Average sales cycle | Total days taken to close won deals ÷ number of won deals |
| Pipeline velocity | Qualified opportunities × average deal value × win rate ÷ average sales cycle in days |
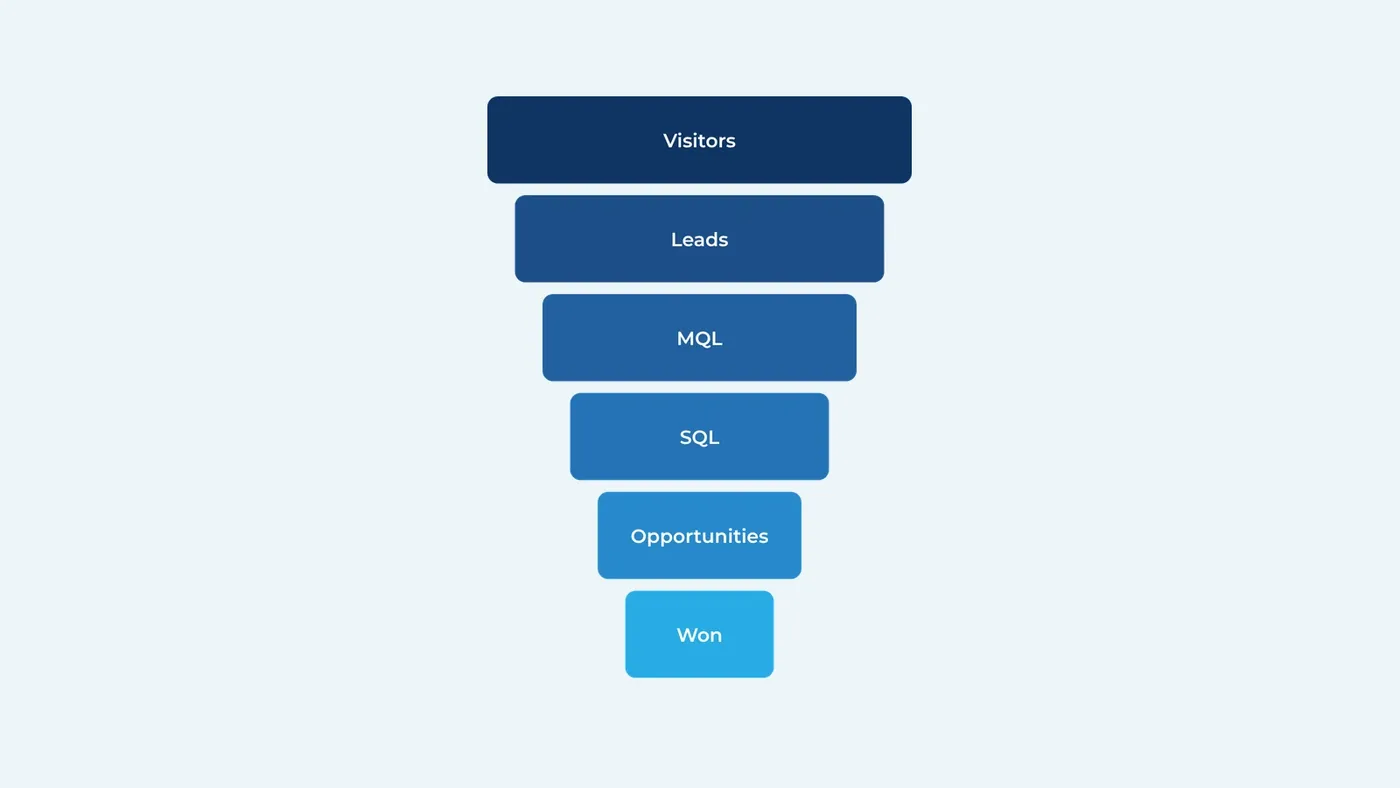
A campaign that generates fewer but better-qualified leads and shortens the buying cycle may be more valuable than one generating a large volume of weak enquiries. If Marketing reports many qualified leads but Sales rejects most of them, the issue may be targeting, qualification criteria, follow-up speed or CRM discipline.
05. Share of voice, share of search and market share
Marketing performance metrics must look beyond immediate conversions. Brands need to be visible and mentally available before customers enter the market. Leadership should compare competitive visibility, branded demand and actual commercial share.
| Metric | Calculation method |
|---|---|
| Share of voice (SOV) | Brand advertising spend, media mentions or category impressions ÷ total spend, mentions or impressions for the measured competitor set × 100 |
| Share of search (SOS) | Search volume for the brand ÷ combined branded search volume for the brand and measured competitors × 100 |
| Market share (SOM) | Company category revenue or unit sales ÷ total category revenue or unit sales × 100 |
| Excess share of voice (ESOV) | Share of voice % − market share % |
120 Relevant brand mentions
880 Mentions for the selected competitor group
1,000 Category total
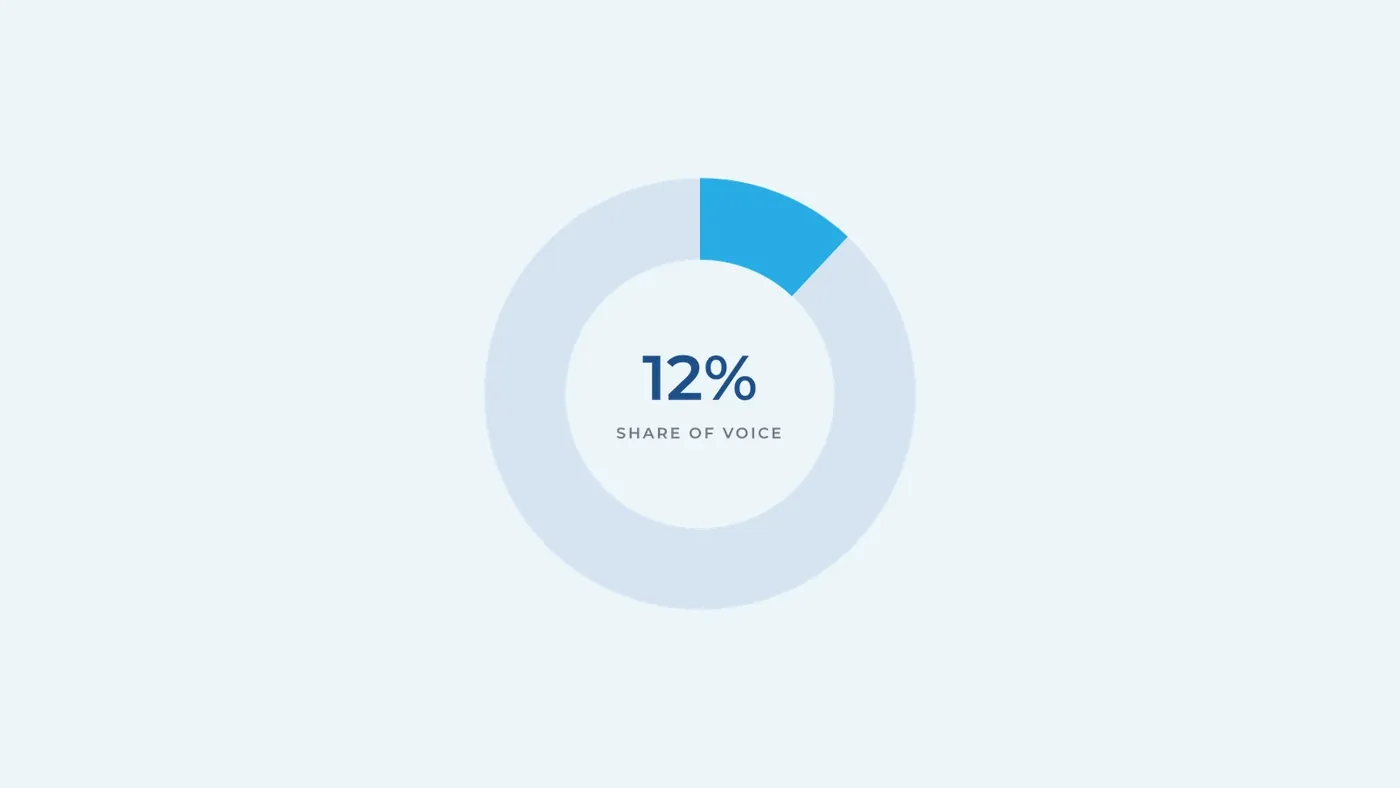
Companies should select one share-of-voice basis, such as paid-media spend, earned-media mentions or digital impressions, and avoid mixing bases. For example, if a brand receives 120 relevant mentions and the selected competitor group receives 880, the category total is 1,000 and the brand has a 12% earned-media share of voice.
07. Marketing investment as a percentage of revenue
Companies should calculate total marketing investment as a percentage of revenue and benchmark it against comparable organizations. The numerator should be defined consistently and may include people, media, technology, agencies, content, events, research and production.
| Metric | Calculation method |
|---|---|
| Marketing investment ratio | Total marketing investment ÷ total revenue × 100 |
| Marketing cost per revenue unit | Total marketing investment ÷ revenue attributed to or influenced by marketing |
| Budget utilization rate | Actual marketing spend ÷ approved marketing budget × 100 |
Benchmarking must account for sector, margin, maturity and ambition. A startup entering a market cannot be compared fairly with an established category leader protecting its position. The useful question is whether the company is investing at the level required to achieve its growth objective, and whether that investment is producing measurable progress.
Recent client snapshot
In a recent engagement with a shared-office provider in Riyadh, Synergi connected fragmented marketing, website and lead-generation data into one performance view. The diagnostic showed that activity was being reported, but the link between content, digital engagement, enquiries and qualified opportunities was not sufficiently visible.
25% Month-on-month growth in social media performance
53% Increase in qualified leads
85% Improvement in website performance and engagement
24% Reduction in cost per qualified lead
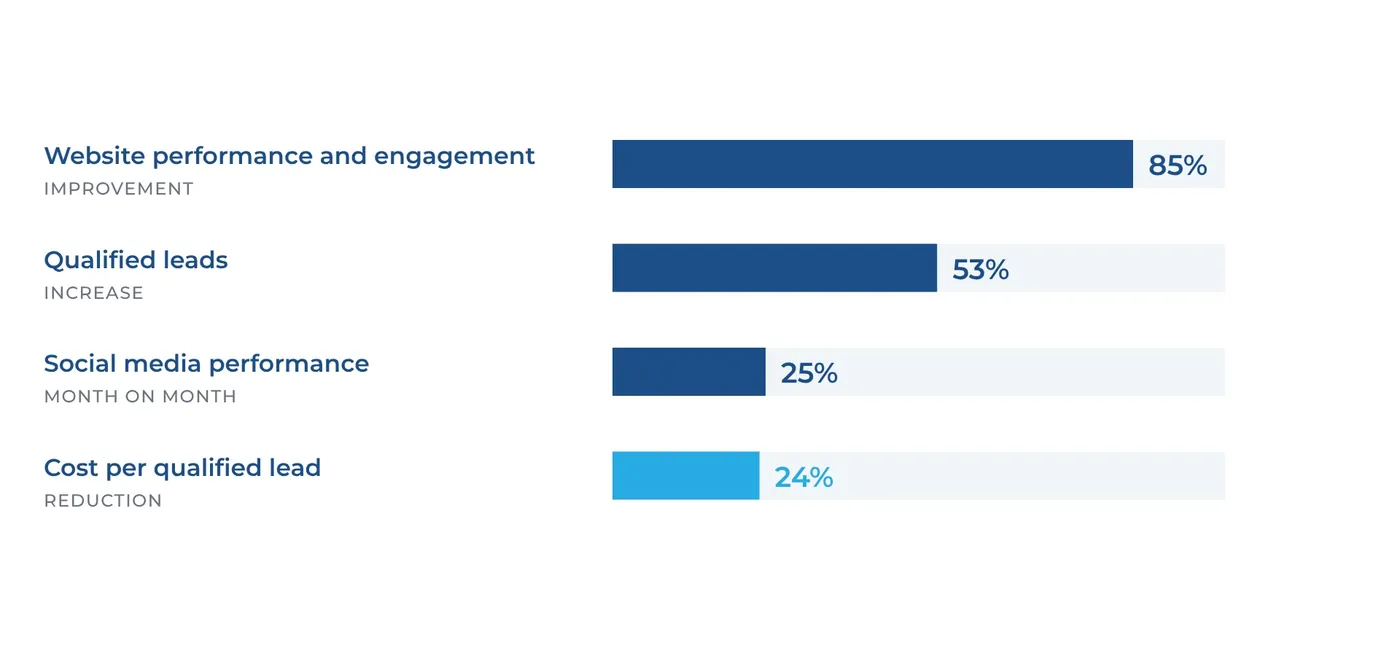
The most important result was not a single dashboard number. It was a change in decision-making: the client could identify which channels and content themes were creating qualified demand, redirect investment faster and hold Marketing and Sales accountable to the same commercial outcomes.
The Synergi approach
At Synergi, we do not treat marketing measurement as a reporting exercise, nor do we assess it only from an agency perspective. We look at marketing from a business perspective: how it supports the company’s commercial priorities, market positioning, customer acquisition and long-term growth.
We assess the function end to end, including strategy, brand, content, digital channels, website, CRM, lead management, Sales alignment, data quality and governance. Our boutique model combines senior strategic expertise with hands-on execution through fractional CMO support, marketing strategy, social media management, brand development, events, PR, website and digital performance services.
More importantly, we become involved in the business decisions that shape growth, from identifying priority markets and customer segments to assessing budgets, commercial opportunities and the capabilities needed to deliver results. Where appropriate, we integrate automation and AI with human judgment to improve speed, consistency and decision quality.
The right dashboard should do more than describe what happened. It should show leadership what to protect, what to improve, where to invest and what to stop.
Not sure your marketing is performing?
Synergi will review your marketing performance metrics, connect your marketing, website and CRM data into one view, and give your leadership team a clear scorecard tied to pipeline and revenue.
Book a marketing performance review Explore our marketing services
Editorial references
- Cross-channel data-driven attribution in Google Analytics 4. Google Analytics Help. Attribution and cross-channel customer journey measurement.
- Introducing Marketing Intelligence. Salesforce. CRM-connected pipeline and revenue measurement.
- The B2B Marketer’s Guide to the Share of Voice Rule. LinkedIn B2B Institute. Brand building, sales activation, share of voice and share of market.
- Customer acquisition cost. HubSpot. Customer acquisition cost, lifetime value, lifecycle conversion and revenue attribution.
06. Social growth, quality of engagement and brand demand
Follower growth and engagement remain useful marketing performance metrics, but only when interpreted in context. For a B2B company, one comment from a qualified decision-maker may matter more than hundreds of passive likes. The objective is not simply a larger audience; it is a more relevant and increasingly engaged audience.
Meaningful engagement should also be reviewed qualitatively through saves, shares, comments from priority decision-makers, sentiment, website visits from social channels, direct traffic and branded search demand.